3. 调试和性能优化
3.1. 定制调试信息
3.1.1. 打印文件名和行号
借助sys.exc_info 模块自己捕获异常,来打印调用者信息,同时打印当前调试信息。
0 1 2 3 4 5 6 7 8 9 10 11 12 13 14 15 16 17 18 | import sys
def xprint(msg=""):
try:
print("do try")
raise Exception
except:
f = sys.exc_info()[2].tb_frame.f_back
print('%s[%s]: %s' % (f.f_code.co_filename, str(f.f_lineno), msg))
def test_xprint():
xprint()
xprint("%d %s" %(10, "hello"))
test_xprint()
>>>
C:/Users/Red/.spyder/test/test.py[218]:
C:/Users/Red/.spyder/test.py[219]: 10 hello
|
3.1.2. 异常时打印函数调用栈
异常发生时,Python默认处理方式将中断程序的运行,有时候我们希望程序继续运行。 可以通过 try 语句结合 sys.exc_info() 和 traceback模块抛出异常,并给出提示信息。
0 1 2 3 4 5 6 7 8 9 10 11 12 13 14 15 16 | import traceback
import sys
def xtry(runstr):
ret, status = None, True
try:
ret = eval(runstr)
except:
info = traceback.format_exc()
try:
raise Exception
except:
f = sys.exc_info()[2].tb_frame.f_back
print('%s[%s]: %s' % (f.f_code.co_filename, str(f.f_lineno), info))
status = False
return status, ret
|
xtry()函数接受一个字符串作为表达式,与xprint()函数类似,在异常出现时打印出文件名和行号,并且借助traceback模块格式化调用栈信息。 同时返回是否出现异常和表达式的执行结果,status为True表示可以正常执行,否则出现异常。
下面是一个示例:
0 1 2 3 4 5 6 7 8 9 10 11 12 13 14 15 16 17 | def divide(a, b):
return a / b
status, ret = xtry("divide0(100, 0)")
print(status, ret)
print("still running!!") # 继续执行
>>>
C:/Users/Red/.spyder/dolist/except.py[37]: Traceback (most recent call last):
File "C:/Users/Red/.spyder/dolist/except.py", line 22, in xtry
ret = eval(runstr)
File "<string>", line 1, in <module>
File "C:/Users/Red/.spyder/dolist/except.py", line 12, in divide0
try:
ZeroDivisionError: division by zero
False None
still running!!
|
3.2. 断言和测试框架
3.2.1. assert 语句
断言语句 assert 在表达式为假时抛出断言异常 AssertionError 并终止程序的执行。 这在调试和测试代码时非常有用。
0 1 2 3 | assert 1 == 2
assert isinstance('str', str)
assert 0
assert False
|
0 和 False是等价的,1 和 True 是等价的,当表达式为假时,抛出如下的异常信息:
0 1 2 3 4 5 6 | assert 1 == 2
>>>
File "C:/Users/Red/.spyder/except.py", line 107, in <module>
assert 1 == 2
AssertionError
|
断言语句还支持一个格式化字符串参数,以逗号区分,用于提供更明确的断言信息。
0 1 2 3 4 5 6 7 | oct_num = -1
assert oct_num in range(10), "Oct number must be in (%d-%d)" % (0, 9)
>>>
File "C:/Users/Red/.spyder/except.py", line 107
assert oct_num in range(10), "Oct number must be in (%d-%d)" % (0, 9)
AssertionError: Oct number must be in (0-9)
|
专门的测试框架工具通常会对 Python 自带的断言功能进行扩展,以提供更强大的测试和诊断能力。
3.2.2. 单元测试模块 unittest
单元测试主要针对最基础的代码可测单元进行测试,比如一个表达式,一个变量值的合法性,一个函数的入参和出参规格直至一个模块的功能。 著名的极限编程中的测试驱动开发(TDD:Test-Driven Development)就是以单元测试为基础的开发方式, 单元测试代码在编写功能代码时同时进行,每次对代码的增删和缺陷修复都要进行单元测试,以保证代码是符合预期的。 这很像在修路的同时,同时修筑了足够高的防护栏,而在赛车选手变换各类驾驶技巧时,不会冲出赛道。
可以这样说,只要单元测试没有漏洞,编码者就有底气说问题已经彻底修复了。
3.2.2.1. unittest 测试用例
Python 自带单元测试框架 unittest , 它将测试用例定义为 TestCase 类。 编写单元测试时,首先需要编写一个测试类,并继承 unittest.TestCase,类中的方法必须以 test 开头:
0 1 2 3 4 5 6 7 8 9 10 11 12 13 14 15 16 17 18 19 20 21 22 23 24 25 26 | import unittest
class test_suit1(unittest.TestCase):
def test1(self):
'''test suit 1''' # 测试用例描述,同用例标题一并显示在测试报告里
self.assertEqual(1, 1)# 测试用例断言,期望 1 == 1,否则抛出异常
class test_suit2(unittest.TestCase):
def test2(self):
'''test suit 2'''
self.assertEqual(2, 0)
unittest.main() # 可以传入 verbosity=1 打印每一测试用例结果
>>>
.F
======================================================================
FAIL: test2 (unit.test_suit2)
test suit 2
----------------------------------------------------------------------
Traceback (most recent call last):
File "/home/red/sdc/lbooks/ml/unit.py", line 14, in test2
self.assertEqual(2, 0)
AssertionError: 2 != 0
----------------------------------------------------------------------
Ran 2 tests in 0.001s
|
测试结果的第一行给出所有测试用例的结果, . 和 F 分别表示测试通过或失败,每一个测试用例对应一个字符。
接着给出出错所用例的类名和描述,并附上对应出错代码的文件和行号等信息。最后给出总的运行用例数和测试耗时。
上面的示例直接通过 unittest.main() 函数运行,也可以在命令行中调用 unittest 模块,注意要注释掉 unittest.main()。
0 | python3.4 -m unittest unit_sample.py # 可以添加 -v 打印每一测试用例结果
|
unittest 目前支持如下断言函数:
名称 等价 版本 assertEqual(a, b) a == b assertNotEqual(a, b) a != b assertTrue(x) bool(x) is True assertFalse(x) bool(x) is False assertIs(a, b) a is b 3.1 assertIsNot(a, b) a is not b 3.1 assertIsNone(x) x is None 3.1 assertIsNotNone(x) x is not None 3.1 assertIn(a, b) a in b 3.1 assertNotIn(a, b) a not in b 3.1 assertIsInstance(a, b) isinstance(a, b) 3.2 assertNotIsInstance(a, b) not isinstance(a, b) 3.2
3.2.2.2. unittest 测试套件
上面的例子在实际的运行中,测试顺序并不是严格按照我们定义的测试用例顺序执行,有时我们的测试用例可能依赖执行顺序,比如打开文件,写文件等。 测试套件 TestSuite 可以解决该问题,同时它可以组织多个脚本文件的测试用例。
0 1 2 3 4 5 6 7 8 9 10 11 12 13 14 15 16 17 18 19 20 21 22 23 24 25 26 27 28 29 30 31 32 | class TestMathFunc(unittest.TestCase):
def test_abs(self):
"""Test method abs()"""
self.assertEqual(1, abs(-1))
self.assertEqual(1, abs(1))
def test_max(self):
"""Test method max(x1,x2...)"""
self.assertEqual(2, max(1, 2))
def test_min(self):
"""Test method min(x1,x2...)"""
self.assertEqual(1, min(1, 2))
# 创建测试套件
suite = unittest.TestSuite()
# 1. 添加部分测试用例
tests = [TestMathFunc("test_max"), TestMathFunc("test_min")]
suite.addTests(tests)
# 2. 添加所有测试用例
suite.addTest(unittest.makeSuite(TestMathFunc))
runner = unittest.TextTestRunner(verbosity=1) # verbosity=0-2 调整输出
runner.run(suite)
>>>
.....
----------------------------------------------------------------------
Ran 5 tests in 0.000s
OK
|
示例中提供了两种向测试套件添加测试用例的方法,通过 addTests() 部分添加测试用例或通过 addTest() 导入套件中全部用例。测试结果中显示运行了5个用例。
3.2.2.3. 测试结果输出到文件
0 1 2 3 4 5 | ......
suite.addTest(unittest.makeSuite(TestMathFunc))
with open('unittest_report.txt', 'w') as f:
runner = unittest.TextTestRunner(stream=f, verbosity=1)
runner.run(suite)
|
查看 unittest_report.txt 文件,可以发现与上面示例相同的输出。这里采用 unittest 自带的 TextTestRunner(),输出结果为普通文本文件。 verbosity 参数可以控制执行结果的输出:0 是简单报告,1 是一般报告,2 是详细报告。
可以借助 HTMLTestRunner 和 xmlrunner 模块生成 html 或者 xml 格式的报告文件。
3.2.2.4. 测试环境的布置和清理
如果测试需要在每次执行之前准备环境,并且在每次执行完后需要进行测试环境的撤销,比如执行前创建临时文件夹,临时文件,测试用数据,连接数据库,创建并连接套接字等, 执行完成之后要删除临时文件夹,临时数据,断开连接。不可能为了每个测试用例都添加准备环境、清理环境的操作。
我们只要在测试类中,重写 unnitest 模块提供的 setUp() 和 tearDown() 两个方法即可。
0 1 2 3 4 5 6 7 8 9 10 11 12 13 14 | class TestMathFunc(unittest.TestCase):
def setUp(self):
print("Prepare unittest environment.")
def tearDown(self):
print("Clean up unittest environment.")
......
>>>
Prepare unittest environment.
Clean up unittest environment.
.Prepare unittest environment.
Clean up unittest environment.
......
|
可以看到 setUp() 和 tearDown() 在每个测试用例执行前后都会执行一次。 也可以借助这一机制,来统计每个测试用例的运行时间。
如果想要在所有测试用例执行之前和结束之后,只执行一次准备和清理动作,可以用 setUpClass() 与 tearDownClass()。
0 1 2 3 4 5 6 7 8 9 10 11 12 13 14 15 16 17 18 | class TestMathFunc(unittest.TestCase):
@classmethod
def setUpClass(cls):
print("Prepare unittest environment.")
@classmethod
def tearDownClass(cls):
print("Clean up unittest environment.")
......
>>>
Prepare unittest environment.
.....Clean up unittest environment.
----------------------------------------------------------------------
Ran 5 tests in 0.000s
OK
|
注意:必须使用 classmethod 修饰符来指明 setUpClass() 与 tearDownClass() 是类的方法,不需要实例化即可执行。
3.2.2.5. 跳过特定测试用例
如果想要跳过某个测试用例不执行,可以在测试函数前使用 skip 修饰器。
0 1 2 3 4 5 6 7 8 9 10 11 12 13 14 15 16 17 18 | class TestMathFunc(unittest.TestCase):
def test_abs(self):
"""Test method abs()"""
self.assertEqual(1, abs(-1))
self.assertEqual(1, abs(1))
@unittest.skip("Don't run it now!")
def test_max(self):
"""Test method max(x1,x2...)"""
self.assertEqual(2, max(1, 2))
......
>>>
s..s.
----------------------------------------------------------------------
Ran 5 tests in 0.001s
OK (skipped=2)
|
可以看到在 test_max() 用例在执行时标记为 s,表示跳过。
skip 修饰器一共有三种:
- unittest.skip(reason) 无条件跳过。
- unittest.skipIf(condition, reason) 当 condition 为 True 时跳过。
- unittest.skipUnless(condition, reason) 当 condition 为 False 时跳过。
3.2.2.6. 参数化测试
如果要针对某个函数,或者类进行多种数据输入组合的测试,特别是完整性测试时,为每一种情况写一句断言,是非常麻烦的事情,借助参数化模块 parameterized,可以解决这一问题。
安装它的命令为 sudo pythonX.Y -m pip install parameterized,注意 Python 版本。
0 1 2 3 4 5 6 7 8 9 10 11 12 13 14 15 16 17 18 19 20 21 22 23 | from parameterized import parameterized
class TestCanDrive(unittest.TestCase):
@parameterized.expand([
[True, True, False], # 也可以是 tuple
[True, False, True],
[False, False, False],
[False, False, False]
])
# 运行时遍历上述列表里的参数,把所有项执行一遍
def test_can_drive(self, with_license, drunk, expected):
status = can_drive(with_license, drunk)
self.assertEqual(status, expected)
suite.addTest(unittest.makeSuite(TestCanDrive))
runner = unittest.TextTestRunner(verbosity=1)
runner.run(suite)
>>>
....
----------------------------------------------------------------------
Ran 4 tests in 0.000s
OK
|
尽管我们只定义了一个测试函数,却运行了4个测试用例。如果测试用例数据非常多,我们可以把需要传递给 parameterized.expand() 函数的列表参数的数据放在一个文件里面,使用的时候读取。这样在修改维护测试数据上都将轻松很多。
3.2.2.7. 批量执行测试用例
尽管通过 import 所有的测试模块脚本,并将它们加入到当前总的测试脚本中的测试套件中,以实现批量处理,但是每次 增删模块,都需要修改当前测试脚本,非常麻烦。
unittest 里的 defaultTestLoader.discover() 方法可以对指定路径下的测试脚本文件进行通配符匹配,直接返回测试套件。
0 1 2 3 4 | cases_suit = unittest.defaultTestLoader.discover("test_dir", \
pattern="test_*.py", top_level_dir=None)
runner = unittest.TextTestRunner(verbosity=1)
runner.run(cases_suit)
|
注意:defaultTestLoader.discover() 方法只处理包类型目录,也即目录下必须存在 __init__.py 文件,top_level_dir 指明包的顶层目录。
3.3. 性能分析
在分析python代码执行效率时经常使用time包中的time.time()和time.clock()函数。但是两者是有区别的。
根据cpu的运行机制,cpu是多任务的,如在多进程的执行过程中,一段时间内会被多个进程或者线程占用。 一个进程从开始到结束其实是在这期间的一系列时间片(tick)上断断续续执行的。 此外,如果cpu是多核的或者超线程的,那么多线程的程序执行占用的cpu时间也可能多于真实世界流逝的时间。所以这就引出了程序执行的cpu时间(在这段系统时间内程序占用cpu运行的时间)和墙上时钟(wall time)。
绝对时间(absolute time):也即真实世界时间(real-world time),由time.time()返回。 它是从某个过去固定的时间点(比如 UNIX epoch为00:00:00 UTC on 01/01/1970)到当前时刻 真实世界经过的秒数。系统通过RTC(real-time clock)电路和纽扣电池来保持该时间。系统启动时读取 该秒数,在运行时,也可以通过NTP协议动态修改该秒数。系统基于该值,通过时区和夏令时转换显示为 便于理解的当地时间。UTC时区又被称为GMT或者Zulu时间。
real-world time或者real time在英文中还被称为墙上时钟(wall time或者wall-clock time),所以time.time() 两次返回的值的差就和墙上挂钟或者手表走过的时间是一样的。计算机中的RTC时钟系统是可以进行调整的, 这和真实世界中的钟表是一样的,任何人造计时装置都会走快走慢,RTC时钟系统也一样。
3.3.1. time和clock函数
- time.time()统计的是墙上时钟(wall time),也就是系统时钟的时间戳(1970纪元后经过的浮点秒数)。所以两次调用的时间差即为系统经过的总时间。
- time.clock()统计的是cpu时间,这在统计某一进程或者线程或函数的执行速度最为合适。两次调用time.clock()函数值即为程序运行占用的cpu时间。cpu时间又可细分为用户时间(User Time)和系统时间(System Time),分别表示进程/线程运行在用户态和内核态所占用的时间。
这两个函数均返回浮点数,单位秒。以下是两个函数的对比:
0 1 2 3 4 5 6 7 8 9 10 11 12 13 14 15 16 17 18 19 20 21 22 | import time
def addto(n):
time.sleep(3) # 区分clock()和time()不同平台实现不同
return sum(range(n + 1))
start = time.time()
addto(10000000)
end = time.time()
print("time.time():\t\t%f" % (end - start))
start = time.clock()
addto(10000000)
end = time.clock()
print("time.clock():\t\t%f" % (end - start))
>>> # Windows 运行结果
time.time(): 3.573660
time.clock(): 3.552534
>>> # Linux 运行结果
time.time(): 4.246678
time.clock(): 1.216453
|
以上结果令人迷惑,在不同的平台上运行结果不一致。Linux上time.clock()要比time.time()短得多,而Windows平台相差不多。
如果去掉测试函数中的sleep(3),则两个函数在Linux平台上的输出也变成接近的。睡眠函数让程序让出cpu,显然在Linux平台上clock()函数统计的是程序实际消耗的cpu时间,而Windows平台返回的则是墙上时间。
通过查看系统clock()函数的底层调用,可以了解不同平台的区别。
0 1 2 3 4 5 6 7 | print(time.get_clock_info("clock"))
>>> # Windows 运行结果
namespace(adjustable=False, implementation='QueryPerformanceCounter()',
monotonic=True, resolution=3.9506172839506174e-07)
>>> # Linux 运行结果
namespace(adjustable=False, implementation='clock()', monotonic=True, resolution=1e-06)
|
Windows 平台底层调用 QueryPerformanceCounter() 函数,它实际上返回的就是墙上时间。
由以上测试用例,可以看出采用 time.clock() 来统计代码运行效率,具有平台不确定性,代码不可移植,该函数官方在Python 3.3版本已不再推荐使用。已被time.perf_counter()和time.process_time()取代。
详细说明请参考 PEP0418 。
3.3.2. 高精度时间统计函数
高精度的时间间隔统计的实现基于cpu频率计数器,最高可以精确到cpu的工作频率。
time.perf_counter() 函数返回cpu时间,包括用户时间和系统时间,sleep 的时间,它包含了当前函数开始和结束间隔内被调度出的时间。
time.process_time() 函数返回本进程或者线程的cpu占用时间,包括用户时间和系统时间,不包含 sleep 时间。
0 1 2 3 4 5 6 7 8 9 10 11 12 13 14 15 16 | start = time.perf_counter()
addto(10000000)
end = time.perf_counter()
print("time.perf_counter():\t%f" % (end - start))
start = time.process_time()
addto(10000000)
end = time.process_time()
print("time.process_time():\t%f" % (end - start))
>>> # Windows 运行结果
time.perf_counter(): 3.553474
time.process_time(): 0.578125
>>> # Linux 运行结果
time.perf_counter(): 4.178790
time.process_time(): 1.130667
|
通常情况下,使用这两个函数来对代码效率进行简单统计。
3.3.3. timeit性能分析模块
timeit模块默认使用 perf_counter() 时钟计时函数。
0 1 2 3 4 5 6 7 | import timeit
# 通过 timer 参数可以指定计时器
# print(timeit.timeit('x=1', timer=time.process_time))
print(timeit.default_timer)
>>>
<built-in function perf_counter>
|
timeit模块提供了 timeit() 和 repeat() 函数用于对代码片段或者函数进行重复测试。
0 1 2 3 4 5 6 7 8 9 10 11 12 13 14 15 16 17 | #看执行1000000次x=1的时间:
print(timeit.timeit('x=1'))
#看x=1的执行时间,执行1次(number可以省略,默认值为1000000):
print(timeit.timeit('x=1', number=1))
#看一个列表生成器的执行时间,执行10000次:
t = timeit.timeit('[i for i in range(100) if i%2==0]', number=10000)
print(t)
t = timeit.timeit('addto(100000)', 'from __main__ import addto', number=1000)
print(t)
>>>
0.013765925919869915
3.950553946197033e-07
0.07114627161354292
2.6092641975410515
|
repeat和timeit用法相似,多了一个repeat参数,表示重复测试的次数(默认值为3), 返回值为一个时间的列表。
0 1 2 3 4 5 6 | t = timeit.repeat('addto(100000)', 'from __main__ import addto', number=100, repeat=3)
print(t)
print(min(t))
>>>
[0.2632288394961506, 0.25551288889255375, 0.2601240493822843]
0.25551288889255375
|
3.3.4. cProfile 和 profile
确定性性能分析((Deterministic Profiling))指的是反映所有的函数调用,返回,和异常事件的执行所用的时间,以及它们之间的时间间隔。相比之下,统计性性能分析指的是取样有效的程序指令,然后推导出所需要的时间,后者花费比较少的开销,但是给出的结果不够精确。
因Python是解释性语言,在执行程序的时候,需要解释器解析执行,这部分的执行是不需要进行性能分析的。Python自动为每一个事件提供一个hook,来定位需要分析的代码。除此之外,因为Python解释型语言的本质往往需要在执行程序的时候加入很多其它的开销,而确定性性能分析只会加入一点点处理开销。这样一来,确定性性能分析其实开销不大,还可以提供丰富的统计信息。
函数调用次数的统计能够被用于确定程序中的bug,比如一个不符合常理的次数,明显偏多之类的,还可以用来确定可能的内联函数。函数内部运行时间的统计可被用来确定”hot loops”,那些运行时间过长,需要优化的部分;累计时间的统计可被用来确定比较高层次的错误,比如算法选择上的错误。
cProfile 和 profile 均是标准库内建的确定性性能分析工具。
profile是原始的纯Python分析器。它提供的函数接口和调用方式与cProfile完全兼容。与cProfile相比,用户可以根据需要,在脚本层面扩展该模块。
cProfile是默认的分析工具,它基于lsprof,一个用C语言实现的扩展库, 底层调用 C 语言接口提供的动态库,在Unix系统上,它通常是位于Python共享库文件夹 /usr/lib/pythonx.y/lib-dynload/下的_lsprof.cpython-xxx-linux-gnu.so。所以相对于profile,它的运行效率要高。
使用 cProfile 进行性能分析有两种方式,可以使用命令行执行,也可以在脚本中导入函数。 使用命令行执行时,无需对脚本做任何改动。
0 1 2 3 4 5 6 7 8 9 10 11 12 13 14 15 16 17 18 19 20 21 22 23 24 25 26 27 28 29 30 31 32 | # cprofile.py 中的测试代码
def addto0(n):
total = 1.0
for i in range(1,n+1):
total += i
return total
def addto1(n):
return addto0(n)
def test_add(n):
for i in range(2):
addto0(n)
for i in range(3):
addto1(n)
test_add(10000000)
# 直接命令行调用cProfile模块
# python -m cProfile -s cumulative cprofile.py
12 function calls in 5.643 seconds
Ordered by: cumulative time
ncalls tottime percall cumtime percall filename:lineno(function)
1 0.000 0.000 5.643 5.643 {built-in method exec}
1 0.000 0.000 5.643 5.643 cprofile.py:7(<module>)
1 0.000 0.000 5.643 5.643 cprofile.py:19(test_add)
5 5.643 1.129 5.643 1.129 cprofile.py:9(addto0)
3 0.000 0.000 3.385 1.128 cprofile.py:16(addto1)
1 0.000 0.000 0.000 0.000 {method 'disable' of '_lsprof.Profiler' objects}
|
-s 参数指明输出排序方式为 cumulative,也即按照函数累计耗时大小排序。这方便找到耗时最久的代码点。
第一行指明脚本中共执行了 12 次函数调用,一共耗时 5.642秒。
- ncalls:每个函数调用的次数,这里它们的和正好是12。
- tottime: 每个函数调用累计耗时,不含函数中子函数耗时。
- percall: 函数每次调用累计耗时的平均时间,等于 tottime / ncalls。
- cumtime: 每个函数调用累计耗时,含函数中子函数耗时。
- precall:函数每次调用累计耗时的平均时间,等于 cumtime / ncalls。
- filename:lineno(function):给出文件名,行号和函数名
test_add()函数被调用1次,其中调用了2次addto0() 和 3次addto1(),addto1()中调用了addto0(), 所以 addto0() 一共被调用了5次。
-s 参数还支持 ncalls,tottime,filename,line和module等排序方式。
代码中直接调用cProfile函数,这里用 ncalls排序:
0 1 2 3 4 5 6 7 8 9 10 11 12 13 14 15 16 | import cProfile
# 直接把分析结果打印到控制台
cProfile.run("test_add(10000000)", sort="ncalls")
>>>
12 function calls in 5.693 seconds
Ordered by: call count
ncalls tottime percall cumtime percall filename:lineno(function)
5 5.693 1.139 5.693 1.139 cprofile.py:11(addto0)
3 0.000 0.000 3.319 1.106 cprofile.py:18(addto1)
1 0.000 0.000 0.000 0.000 {method 'disable' of '_lsprof.Profiler' objects}
1 0.000 0.000 5.693 5.693 {built-in method exec}
1 0.000 0.000 5.693 5.693 <string>:1(<module>)
1 0.000 0.000 5.693 5.693 cprofile.py:21(test_add)
|
3.3.4.1. pstats分析输出结果
cProfile 统计结果输出到文件:
0 1 2 | # python -m cProfile -o profile.stats cprofile.py # 命令方式
cProfile.run("addto(10000000)", filename="profile.stats")# 脚本调用函数方式
|
pstates 模块完成对文件 profile.stats 的分析。print_stats()输出跟之前一样的累计报告信息。
0 1 2 3 4 5 6 7 8 9 10 11 12 13 14 15 16 17 | import pstats
p = pstats.Stats("profile.stats")
p.sort_stats("cumulative")
p.print_stats()
>>>
12 function calls in 5.631 seconds
Ordered by: cumulative time
ncalls tottime percall cumtime percall filename:lineno(function)
1 0.000 0.000 5.631 5.631 {built-in method exec}
1 0.000 0.000 5.631 5.631 cprofile.py:7(<module>)
1 0.000 0.000 5.631 5.631 cprofile.py:21(test_add)
5 5.631 1.126 5.631 1.126 cprofile.py:11(addto0)
3 0.000 0.000 3.378 1.126 cprofile.py:18(addto1)
1 0.000 0.000 0.000 0.000 {method 'disable' of '_lsprof.Profiler' objects}
|
为了追溯关心的函数,可以通过print_callers()打印调用者的信息。
0 1 2 3 4 5 6 7 8 9 10 11 12 13 | p.print_callers()
>>>
Ordered by: cumulative time
Function was called by...
ncalls tottime cumtime
{built-in method exec} <-
cprofile.py:7(<module>) <- 1 0.000 5.631 {built-in method exec}
cprofile.py:21(test_add) <- 1 0.000 5.631 cprofile.py:7(<module>)
cprofile.py:11(addto0) <- 3 3.378 3.378 cprofile.py:18(addto1)
2 2.252 2.252 cprofile.py:21(test_add)
cprofile.py:18(addto1) <- 3 0.000 3.378 cprofile.py:21(test_add)
{method 'disable' of '_lsprof.Profiler' objects} <-
|
反过来,还可以通过print_callees()打印被调用者的信息。
0 1 2 3 4 5 6 7 8 9 10 11 12 13 | p.print_callees()
>>>
Ordered by: cumulative time
Function called...
ncalls tottime cumtime
{built-in method exec} -> 1 0.000 5.631 cprofile.py:7(<module>)
cprofile.py:7(<module>) -> 1 0.000 5.631 cprofile.py:21(test_add)
cprofile.py:21(test_add) -> 2 2.252 2.252 cprofile.py:11(addto0)
3 0.000 3.378 cprofile.py:18(addto1)
cprofile.py:11(addto0) ->
cprofile.py:18(addto1) -> 3 3.378 3.378 cprofile.py:11(addto0)
{method 'disable' of '_lsprof.Profiler' objects} ->
|
查看前特定行的函数信息,如下所示:
0 1 2 3 4 5 6 7 8 9 10 11 12 13 14 15 16 | # 打印指定的前多少行
p.print_stats(2)
# 以百分比,打印前50%的行数
p.print_stats(0.5)
>>>
...
ncalls tottime percall cumtime percall filename:lineno(function)
1 0.000 0.000 5.631 5.631 {built-in method exec}
1 0.000 0.000 5.631 5.631 cprofile.py:7(<module>)
...
ncalls tottime percall cumtime percall filename:lineno(function)
1 0.000 0.000 5.631 5.631 {built-in method exec}
1 0.000 0.000 5.631 5.631 cprofile.py:7(<module>)
1 0.000 0.000 5.631 5.631 cprofile.py:21(test_add)
|
查看给定的函数调用信息,比如想查看哪些函数调用了 addto0() 函数:
0 1 2 3 4 5 6 7 8 9 | p.print_callers("addto0")
>>>
Ordered by: cumulative time
List reduced from 6 to 1 due to restriction <'addto0'>
Function was called by...
ncalls tottime cumtime
cprofile.py:11(addto0) <- 3 3.378 3.378 cprofile.py:18(addto1)
2 2.252 2.252 cprofile.py:21(test_add)
|
同理,如果要查看test_add()函数调用了哪些函数:
0 1 2 3 4 5 6 7 8 9 | p.print_callees("test_add")
>>>
Ordered by: cumulative time
List reduced from 6 to 1 due to restriction <'test_add'>
Function called...
ncalls tottime cumtime
cprofile.py:21(test_add) -> 2 2.252 2.252 cprofile.py:11(addto0)
3 0.000 3.378 cprofile.py:18(addto1)
|
3.3.4.2. cProfile数据可视化
使用 gprof2dot 脚本和 dot命令可以根据cProfile统计信息生成函数调用流程图。
0 1 | # pip install gprof2dot
# gprof2dot -f pstats profile.stats | dot -Tpng -o output.png
|
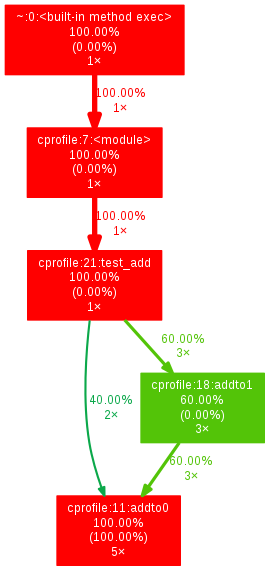
gprof2dot生成的函数调用流程图
3.3.5. 逐行分析模块line_profiler
3.4. ipython
ipython 是基于 Python 的交互式 shell,比默认的 python shell 强大很多:支持变量自动补全,自动缩进,支持 bash shell 命令,内置了许多很有用的功能和函数。
ipython 安装非常简单,Windows 平台需额外安装 pyreadline 用于支持命令补全和颜色显示等功能:
0 1 | # pip install ipython
# pip install pyreadline
|
ipython 的交互提示符总是以 In [n]: 开始,其中 n 表示输入命令的编号:
0 1 2 3 4 5 6 | (py36) C:\Users\Red>ipython
Python 3.6.2 |Continuum Analytics, Inc.| (default, Jul 20 2017, 12:30:02)
[MSC v.1900 64 bit (AMD64)]
Type 'copyright', 'credits' or 'license' for more information
IPython 6.1.0 -- An enhanced Interactive Python. Type '?' for help.
In [1]:
|
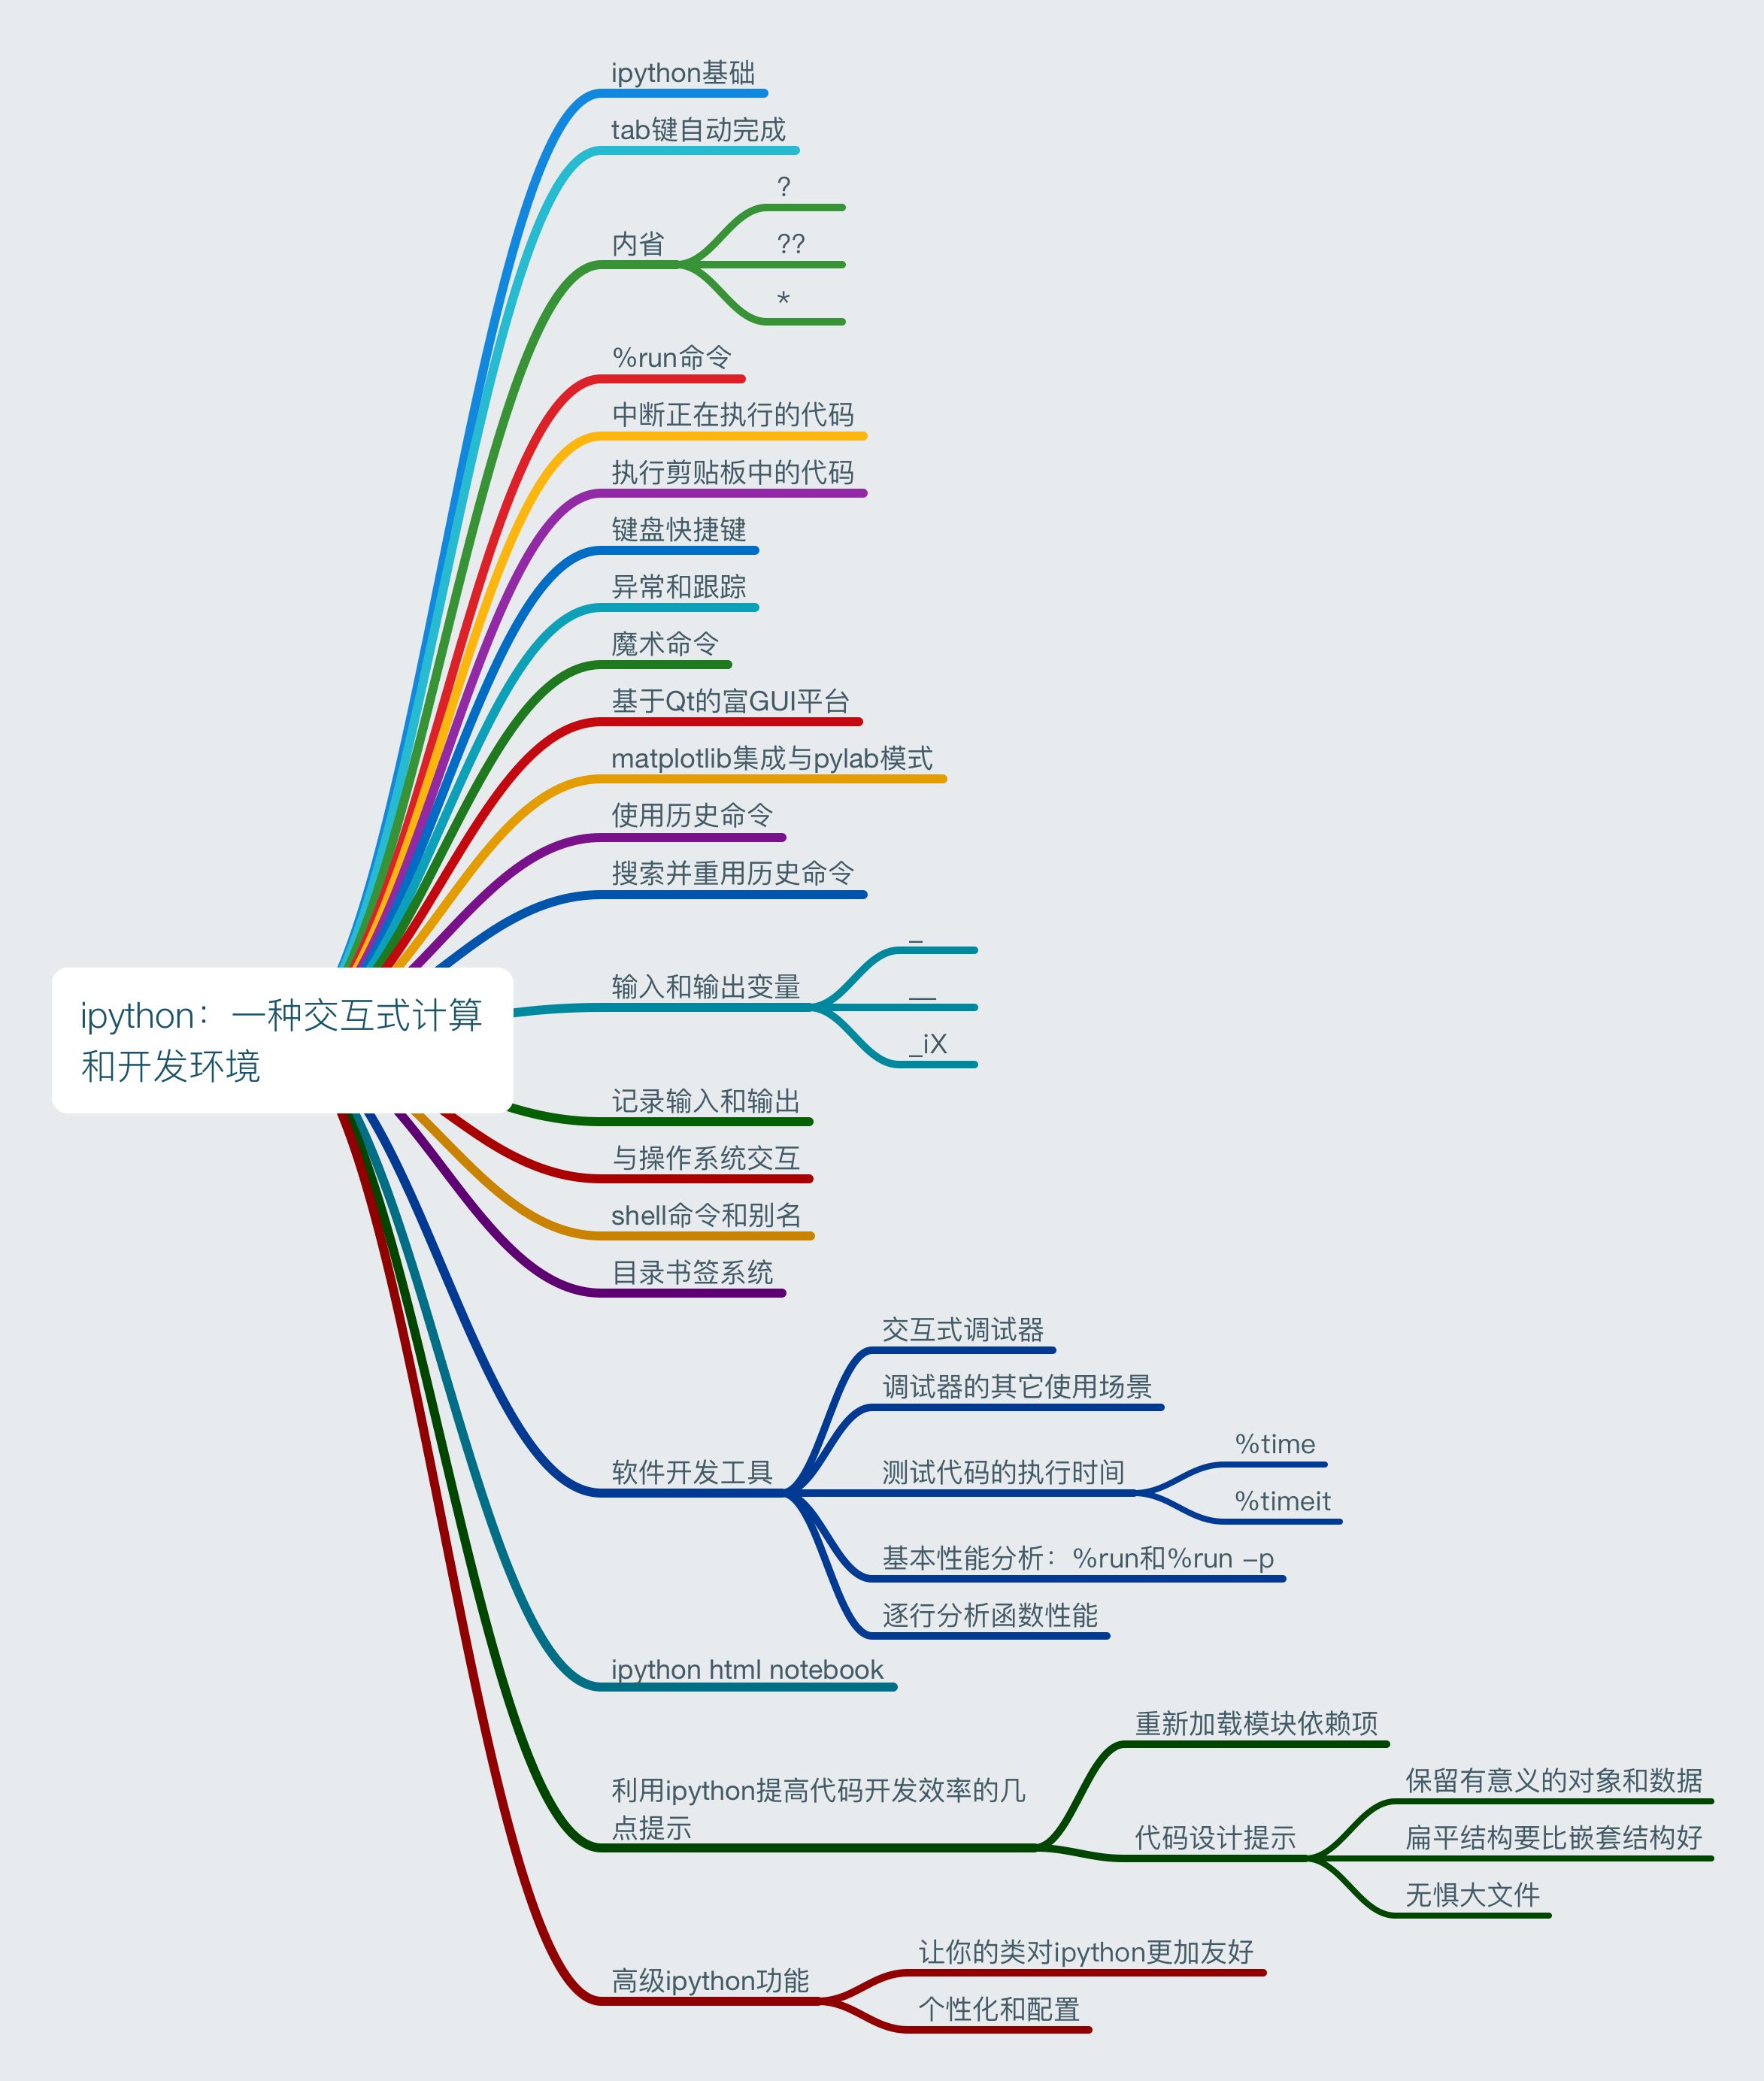
ipython 功能列表(图自网络)
3.4.1. ipython 功能简介
查看模块中所有函数,可以在 ‘.’ 之后按 Tab 键:
0 1 2 3 4 | In [11]: np.random.[Tab]
absolute_import bytes() division geometric() info
bench() chisquare() exponential() get_state() laplace()
beta() choice() f() gumbel() Lock()
binomial() dirichlet() gamma() hypergeometric() logistic()
|
tab 键可以自动补全命令或者函数,极大提高开发效率:
0 1 2 | In [4]: %hist[Tab]
%hist
%history
|
在变量的前面或后面添加问号(?)显示该对象的帮助信息,这就叫做对象的内省。这比 python 中的 help 命令方便多了:
0 1 2 3 4 5 6 7 | # 查看 ? 自身的帮助信息
In [16]: ?
......
? -> Introduction and overview of IPython's features (this screen).
object? -> Details about 'object'.
object?? -> More detailed, verbose information about 'object'.
%quickref -> Quick reference of all IPython specific syntax and magics.
help -> Access Python's own help system.
|
?? 可显示更多信息,例如函数源码。
0 1 2 3 4 5 6 7 8 9 10 | In [21]: def test(a):
...: print(a)
...:
In [22]: test??
Signature: test(a)
Source:
def test(a):
print(a)
File: c:\users\red\<ipython-input-21-e5cfd00ad69a>
Type: function
|
魔术命令是 ipython 的另一大特色:
0 1 2 3 4 5 6 7 8 9 10 11 12 13 14 | %quickref 显示IPython的快速参考
%magic 显示所有魔术命令的详细文档
%debug 从最新的异常跟踪的底部进入交互式调试器
%hist 打印命令的输入(可选输出)历史
%pdb 在异常发生后自动进入调试器
%paste 执行剪贴板中的Python代码
%cpaste 打开一个特殊提示符以便手工粘贴待执行的Python代码
%reset 删除interactive命名空间中的全部变量/名称
%page OBJECT 通过分页器打印输出OBJECT
%run script.py 在IPython中执行一个Python脚本文件
%prun statement 通过cProfile执行statement,并打印分析器的输出结果
%time statement 报告statement的执行时间
%timeit statement 多次执行statement以计算系综平均执行时间。对那些执行时 间非常小的代码很有用
%who、%who_ls、%whos 显示interactive命名空间中定义的变量,信息级别/冗余度可变
%xdel variable 删除variable,并尝试清除其在IPython中的对象上的一切引用
|
%time 和 %timeit 是非常便利的测试代码执行时间的魔术命令,time 执行一次,而 timeit 执行多次取平均。
0 1 2 3 4 5 6 7 8 9 10 11 | In [31]: def sumto(n):
...: sum = 0
...: for i in range(n+1):
...: sum += i
...: return sum
In [32]: %time sumto(100000)
Wall time: 6.98 ms
Out[32]: 5000050000
In [33]: %timeit sumto(100000)
7.44 ms ± 361 µs per loop (mean ± std. dev. of 7 runs, 100 loops each)
|
更多命令请使用 %quickref 和 %magic 来显示 IPython 快速参考。
3.5. Jupyter Notebook
Jupyter Notebook 的前身被称为 IPython notebook,是一个交互式的 web 应用程序,显然 Notebook 是笔记本的意思,可以将命令和结果记录为一个扩展名为 .ipynb 的文件,通过它非常方便创建和共享程序文档,支持数学方程,内嵌图片和 markdown 语法。
Jupyter Notebook 建立在 IPython 基础之上,所以继承了 IPython 的强大扩展功能,是网页版的 IPython,所以访问它就要通过浏览器。
0 1 | $ pip install jupyter
$ jupyter notebook # 启动命令
|
启动 jupyter notebook 之后在浏览器中输入 http://localhost:8888 即可。
如果我们在 github 或者其他网站发现一个 .ipynb,或者 email 中发来嵌入一条链接,我们想在线浏览该文件,可以通过 https://nbviewer.jupyter.org/ 网站实现:只要在页面的地址框填入 .ipynb 超链接即可。